I’ve been looking at trying to get some Azure SQL Database wait stats for some time now. We’ve had the useful resource statistics dynamic management views for a while but they only really provided information of utilisation of the CPU, I/O, and memory resources.
Now we have sys.dm_db_wait_stats for Azure SQL Database which gives us more information on our waits and lets us understand where our bottleneck is and whether we should be tuning our queries or perhaps choosing another service tier.
Utilising it in a format that is similar to the IaaS usage (with WaitS for wait seconds and the Percentage, ) we can build the query below for Azure SQL Database;
SELECT   TOP (10) wait_type,
                  CAST (([wait_time_ms] / 1000.0) AS DECIMAL (16, 2)) AS [WaitS],
                  CAST (100.0 * [wait_time_ms] / SUM([wait_time_ms]) OVER () AS DECIMAL (16, 2)) AS [Percentage]
FROM     sys.dm_db_wait_stats
ORDER BY [Percentage] DESC;
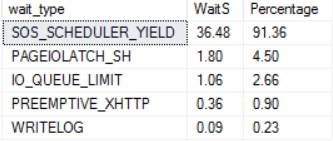
For a sample, one of my databases revealed;
The orginal article on docs.microsoft.com, containing a useful list of waits amongst other information, can be found here
The orginal Iaas wait stats query by Paul Randal can be found here and I’d recommend reading the whole article if you haven’t already.
Thanks for reading!

